CATEGORIES
SEARCH
CONTACT
25 Alderson Rd
Fairview Downs
Hamilton 3214
New Zealand
PH 64-212956469
“Every essential element either in our fertilizer or diet is a contaminant if over supplied.”
— Brian McLeod
PH Soil PH understanding the simplicity
PH (water) understanding and why do we see the soil PH decrease year by year
Bryan McLeod
My friend Richard Stone from NSW Australia commented to me recently that farmers were asking many questions about pH especially why it decreases from year to year?
The following is not a scientific explanation but one of simple understanding.
PH is one of the most misunderstood factors in our soil reports. The assumptions are made that if we have a good ph then our soil is nutritionally sound, or if we have an alkaline soil then there is an abundance of calcium. PH is simply just a reading of the amount of hydrogen ion activity in the soil moisture.
Firstly it is most important to understand that the PH of a soil is the result of the balance of cations (positive charged Ca, Mg, K & Na, it is not the course of the soil balance, it is the result of the balance of Ca, Mg, K and Na.
Your soil contains both positive and negatively charge elements, it is the major positively charged elements that directly affect or construct the pH
It is the balance of these four major cations (positively charged) calcium, magnesium, potassium and sodium that directly influences ph.
So the application of Ca, Mg, K or Na will all help to construct a pH
Let’s look at pH construction
When compared to Ca
Mg is 1.66 times more effective than Ca at increasing pH
K is 2 times more effective than Ca
Na is 4 times more effective than Ca at raising pH. This is why salt scalds can have a pH > 9
Just understanding this factor alone can change the way you look at a soil test and address your fertility program.
A balanced soil will look something this – This being an example only
68% Calcium
12% Magnesium
4% Potassium
2% Sodium
2% Trace (variable)
12% Hydrogen
100%
PH gives no suggestion as to which nutrients are grossly deficient or to what degree your soil nutrients are balanced or imbalanced.
So what causes soil acidity? Why does the pH decrease
We can look at pH as displacement.
As plants grow and feed on soil minerals, they release hydrogen into the soil from their root system to exchange for positively charged elements. As soil hydrogen increases the pH goes down, when calcium, magnesium, potassium or sodium are applied the pH goes up due to the displacement of the hydrogen.
So the pH goes down and up due to a soils activity & productivity
In normal circumstances a cereal crop will normally drop the pH 1 point each year so in 10 years the soil could go from a 6 down to a 5pH. Legume crops are more acidifying due to their release of N into the soil. See chart below
There are other factors that can also come into play. Eg on high Mg soils as the available Ca decreases available Mg will increase and in this case your pH can increase – remember Mg is more pH forming than Ca. This is common in Northern Victoria and the Adelaide Hills
Hydrogen (H) the H in pH decreases pH – Info from SA Primary Industries
Acids result from both soil and plant processes, both natural and accelerated by agriculture.
- Ammoniacal (NH4) fertiliser use (including urea, MAP, DAP, Ammonium Nitrate, Ammonium Sulphate)
- Product removal (hay, crop, animal). Especially lucerne
Dung and legume product removal is the most important. K(potassium) removal on dairy farms, mainly in urine, to gateways, camping areas, raceways, from hillsides to flats, to cowsheds, to night grazing areas.
Agricultural plants redistribute acidity in the soil profile, eg lucerne
- Nitrate leaching (N03). Worst when growing legumes, using N fertilisers
when there are good autumn rains in drier climates, promoting good pasture
growth
- Increased soil organic matter
Acidifying effects of some N fertilisers
Kilograms of Lime (CaCo3) required per kilogram of nitrogen in the applied fertiliser required to maintain the soil pH.
South Australian Primary Industries report
Note that the readings are per kg of nitrogen. Eg. 100kg of urea = 46kg of N = an average loss of 83kg of lime equivalent to neutralise the acidifying effect. For the application of 200kg of N you need 400kg of lime to counter the acidifying effect. Add this to acidifying effect of your annual pasture production (see below) eg 15tn DM/ha in a good pasture = another 450kg of lime = a total of approx 1tn/ha of lime annually is required to maintain the status quo when applying 200kg of N/ha
South Australian Primary Industries report
See how lucerne requires 60kg of lime/tn DM to balance the decrease in pH compared to milk requiring only 4. So 4 cuts of lucerne = 12tn = 0.75tn of lime/ha, this is significant in understand the amount of fertilise removed through cropping
Noting that this chart is to only demonstrate a pH decrease, there are other elements involved in a pH reduction such as magnesium and potassium.
These two charts are telling us that we always need to be aware of soil reactions to whatever we do with or apply to our soil
Both your fertiliser applications and the crops you grow control how your soil reacts and just what happens to the pH.
Always remember the pH is a result of the nutrient balance in your soil not the reason why
Here are some examples where each of cations Ca, Mg, K or Na naturally dominate the construction of a soils pH
High Ca soils in South Australia on the Yorke Peninsula.
Base Saturation Ca @ 82%
Desired Found
High Mg soils in SA and along the Murray River pH >8.4 with low calcium – Mg 32%
Extremely high sodium, salt pans with pH >8.4 – see Na @ 19%
Very high potassium, NSW – 11%, I have recorded levels to 16%
PH is only a measurement of soil hydrogen, not an indication of soil fertility or mineral balance
A golden rule: Never lime to construct a pH, lime to provide calcium only. If you balance a soil correctly the pH will be automatically fall into the desired range.
PH construction
Table 2. Comparisons of Base Saturation Percentages for five different soils.
PH and various ways of construction
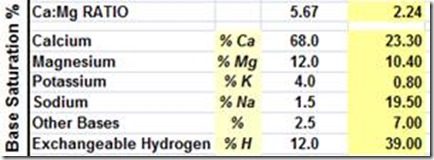
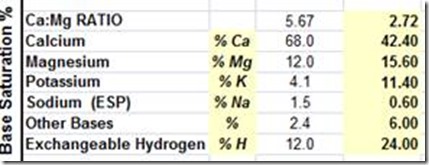
Below is a classic actual illustration of how the pH of the soil can be constructed; Note that all the pH readings are very similar but constructed differently.
Four soil samples were taken from certain positions in and around a salt patch on a farm in WA, starting in the centre of the salt scald where nothing was growing and working out to an area 100 metres from the edge of the scald to where the crop was flourishing.
In N01 the 8.3pH is being constructed with sodium (yellow), N04 the 8.1pH is constructed with calcium. The pH levels on all are almost the same but are constructed in different ways
N01 = no growth, N02 edge of salt scald = no growth, N03 50 metres from edge of salt scald some growth, N0 4 100 metres from salt scald = excellent growth.
This is a great example demonstrating how we can have similar pH’s readings but constructed differently and with a significant outcome for productivity
Based on this you can see just how important it is to know how the pH of your soil is constructed, is it constructed with Ca or Mg or K or Na or is your pH well constructed, just looking at the pH doesn’t really tell you the nutritional status of your soil.


